
We do a lot of Benchmarking and functionality testing here at Bitfusion.io to continuously evaluate our application acceleration technology across different CPU architectures, storage and memory configurations, and accelerators such as GPUs and FPGAs. As a startup, we have various high performance systems in-house, but there are always newer and more exciting hardware configurations for us to test and develop on. To compound the problem further, more often than not different cloud and hardware provider offer access to different types of hardware.
For example, Amazon has a nice selection of systems when it comes to Intel Sandybridge and Haswell processors, but their GPU selection of K520 GRID Nvidia GPUs in the g2.2xlarge and g2.8xlarge instances is rather dated by today’s standards. To get access to machines with multiple Nvidia state of the art K80 GPUs we had the need to quickly deploy our software on other cloud providers such as Softlayer where K80s are available. To test on AMD CPUs or to access some of our FPGAs we needed an easy way to do the same on our bare-metal servers in Rackspace. And finally, as mentioned before, we have several local systems which also needed to be part of the test infrastructure – I think you get the idea.
To solve the problem we needed three things: First, an ability to provision systems quickly on demand and bring them back down – a startup is always on the clock and on a budget. Second, we needed an easy way to deploy our benchmarks and testing across any infrastructure transparently and reliably. Third, we needed a way to get performance and monitoring data for our runs and to quickly visualize them – the tricky part here was we were shooting for high granularity data collection without interfering with the actual performance itself.
To solve these problems we adopted the following high-level architecture. To manage the systems inside our office and across the different cloud providers we utilized SaltStack exclusively. SaltStack manages all our machine images, created with Packer, for the various systems and cloud providers. While in general the images are fairly similar, different hardware occasionally needs specific run-time environment and drivers on the host systems, especially when it comes to accelerators. Using SaltStack we then create and manage dynamic pools of machines, where machines can be added or removed at any time from our pools.
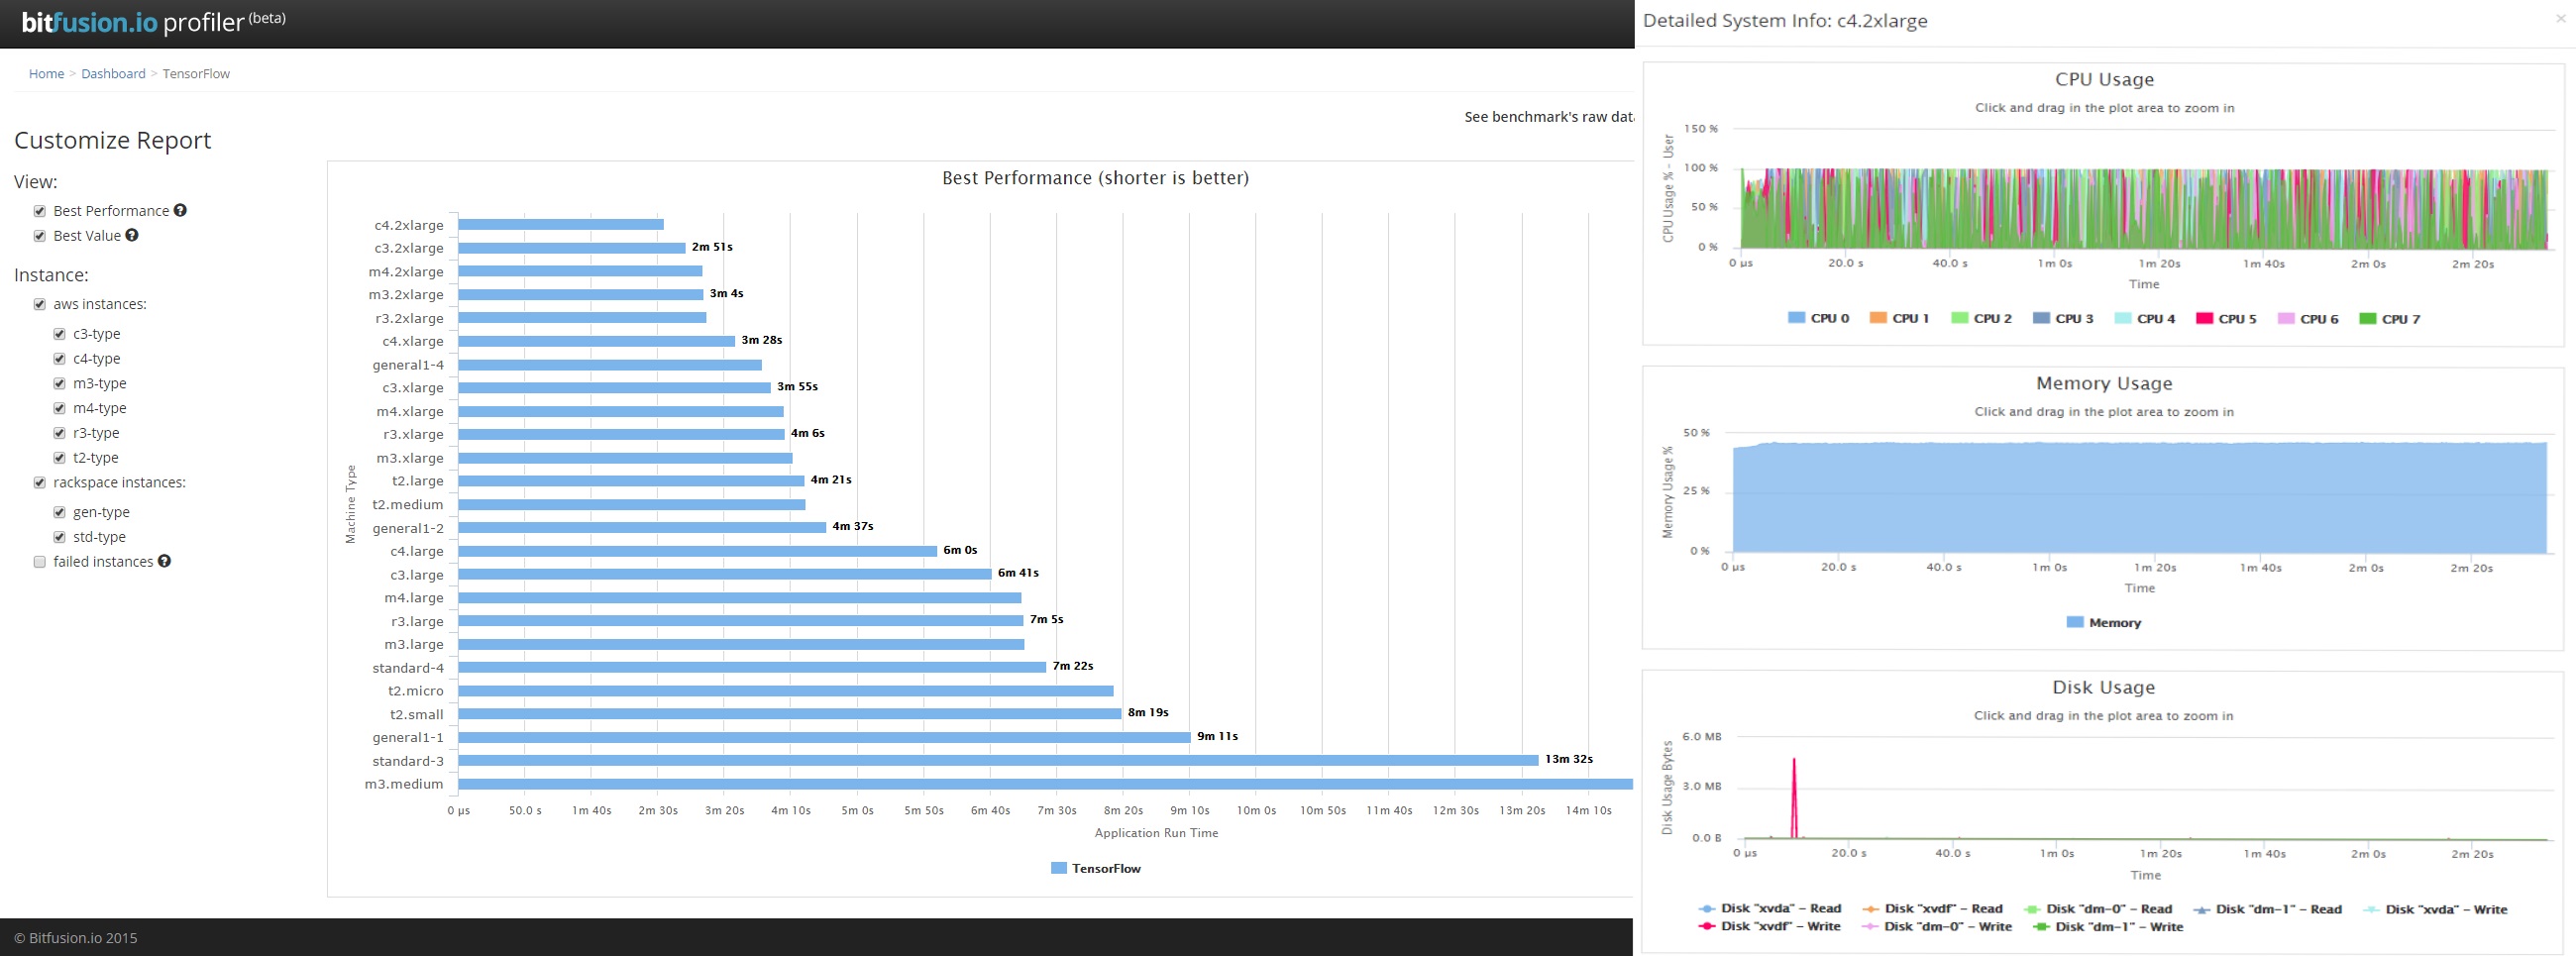
All our builds, applications, and benchmarks live within Docker containers, along with various performance monitoring software. We can monitor performance from inside containers as well as from outside containers depending what it is exactly that we are looking for – some tools we utilize here include collectl and sysdig. Any streaming performance data we pipe out to Elasticsearch, taking care to cluster the streaming data periodically such that we only minimally disturb any resource measurements or I/O activity. Once the data is in Elasticsearch the visualization is just a simple exercise in data querying and java scripting. Below is one possible visualizations example of this data from our free Profiler tool which we discuss in more detail toward the end of this post:
Since we have a use-case which differs quite considerably from the usual Docker case of many small web sites or microservices, we have many more Docker container images and they are much larger than usual. In order to manage these we run our own instance of Docker Trusted Registry so that we keep the data traffic local when pushing or pulling container images to and from the registry. As a result of our obsession with performance, we run overlayfs as the Docker graph backend. The overlayfs driver is the component of Docker which manages all the layers of the files in the container images. Whilst there are several options here, overlayfs is the preferred, and fastest, choice going forward. It does have some caveats, we had to move to Linux Kernel 4.2+ and Docker 1.8.1 in order to achieve a stable configuration, and the underlying file system on which overlayfs is layered requires a configuration with a very large number of “inodes”, the data element which records where files are stored on the disk. This means the underlying file system must be specially formatted with a much larger number of inodes than normal. This can be done using a command such as
# mke2fs -N <desired inodes> -t ext4 ….
One major advantage of using Saltstack to manage our docker containers is that the Docker event stream. Events generated whenever a docker container is started, stopped or otherwise changes state can be trivially exposed on the Saltstack event-bus, where Saltstack Reactors can listen and respond to Docker events by triggering Saltstack actions, or sending messages to other systems.
All Docker containers across our pools are managed via an asynchronous event API which we wrote in-house. We wrote this API in house as it allows us to do run-time profiling of entire tool chain flows in diverse fields such as genomics, semiconductors, and machine learning just to name a few. Using our proprietary Boost technology we then automatically optimize these tool pipelines for maximum performance across heterogeneous compute clusters. The high-level diagram below illustrates one possible use case where thin container clients leverage heterogeneous containers to obtain compute acceleration:

One quick note regarding accelerators and device pass through, as of SaltStack version 2015.8.5 Docker device pass-through is not natively supported, this can be solved with a small patch to the SaltStack docker driver which we wrote internally and which can be found here:
https://github.com/bitfusionio/saltpatches
For day to day use, all the above is triggered from our Jenkins build servers. However, for those interested in taking a lightweight version of our profiling architecture for a spin, we put a web front-end on this flow which can be found at http://profiler.bitfusionlabs.com – here you can build any type of Docker based application benchmark directly from a browser exposed terminal, and can get quick performance results from various instance types across multiple cloud providers. Feel free to share the benchmarks with your friends and colleagues, or make them public so that others can benefit from them as well.
This article is part of our Docker and the Future of Configuration Management blog roundup running this November. If you have an opinion or experience on the topic you can contribute as well!
