Tag Archives: performance

DORA AI Coding Report Breakdown

There’s a new DORA report out from Google, but it’s not the usual DevOps one we’ve come to expect – this one is entirely focused on the state of AI-assisted software development.

That’s not too surprising, straight up DevOps is last decade’s news – Gene Kim rebranded the DevOps Enterprise Summit and is publishing vibe coding books, the DevOps OGs like Patrick Debois and John Willis have been focusing on AI building, and so it makes sense that the DORA crew are also poking in that direction.

A lot of the shift in DevOps in recent years has been towards focusing on developer productivity. Whether that’s the rise of platforms to take burden and complexity away from devs, to Nicole Forsgren’s new SPACE metrics that extended her previous Accelerate/DORA metrics that were focused just on software delivery, everyone is keenly aware that unlocking the developers’ ability to create is important.

Companies I work with are really prioritizing that. At ServiceNow, they got Windsurf licenses for all and report a 10% productivity boost from it. And just “we have some AI” isn’t enough, Meta just cut one of their major AI teams because they had “gotten too bureaucratic” and slow so they wanted to move people to a newer team where they could get more done. So companies are taking developer productivity very seriously and spending real money and making big changes to get it.

Understanding Your Software Delivery Performance

As you read the report, you’ll notice that large chunks of it are NOT about AI directly. This first chapter, for example, recaps the important areas from previous DORA reports. It talks about metrics for software delivery and characterizes kinds of teams you see in the wild and their clusters of function and dysfunction. You don’t really get to AI till page 23.

Is this “AI-washing”? If so, it’s justified. People want “AI” to be the solution when they don’t understand their problem, or how to measure whether their problem is solved – AI can help with software engineering and DevOps but it does nothing to change the fundamental nature of any of it, so if you don’t understand the non-AI basics, if you’re handed AI to loose on your company you may as well be an armed toddler.

AI Adoption and Use

The report has good stats that dig deeper than news reports – while 90% of people are “using AI”, in general they use it maybe 1-2 hours out of their day and don’t go to it first all the time.

The thing I found the most surprising was what people were using it for. In my experience folks are using AI for the lighter work more often than actually writing code, but their research showed writing code was by far the most common use case (60%) and stuff like internal communication the least common task (48%) (outside calendar management at 25%, but the tools for that are terrible IMO).

Chatbots and IDEs are the vast majority of how people interact with AI still, integrated tool platforms only have 18% traction.

People do in general believe they’re being more productive from using AI, by a wide margin, and also believe their code quality has gone up! Pure vibe coding makes terrible quality code, I believe this is because how real coders are using AI is more thoughtful than just “write this for me.” And this is borne out in their trust metrics – most people do NOT trust AI output. 76% of respondents trust AI somewhat, a little, or not at all – despite 84% believing it has increased their productivity.

I think that’s super healthy – you should not trust AI output, but if you keep that in mind, it lets you use it and be more productive. You just have to double check and not expect magic. Consider that ServiceNow article I linked above about their Windsurf adoption, it’s not reastic to think AI is going to give you orders of magnitude of coding productivity increase – 10% is great though, more of an improvement than most other things you can do!

AI and Key Outcomes

That leads us into the meatier portion of the report, which is taking the research past “what people think” and trying to correlate real outcomes to these factors. Which is a little ticky, because developer morale is a part of what contributes to delivery and there may be a “placebo factor” where believing AI tools are making you better, makes you better whether or not the tool is contributing!

What they found is that while AI use does really improve individual effectiveness, code quality, and valuable work, it doesn’t help with friction and burnout, and has a significant negative effect on software delivery instability.

So what do we make of increased software delivery instability when we think we’re generating more and better code? And we think the org performance is still doing better? The report doesn’t know either.

My theory is similar to the answer to “why doesn’t everyone run multi-region systems when AWS us-east goes down from time to time?” Just to refresh you on the answer to that one, “it’s more expensive to do it right than to have an outage from time to time.” If you can cram more code down the pipe, you get more changes and therefore more instability. But just like companies gave up on shipping bug-free code long ago, some degree of failure with the tradeoff of shipping more stuff is a net financial win.

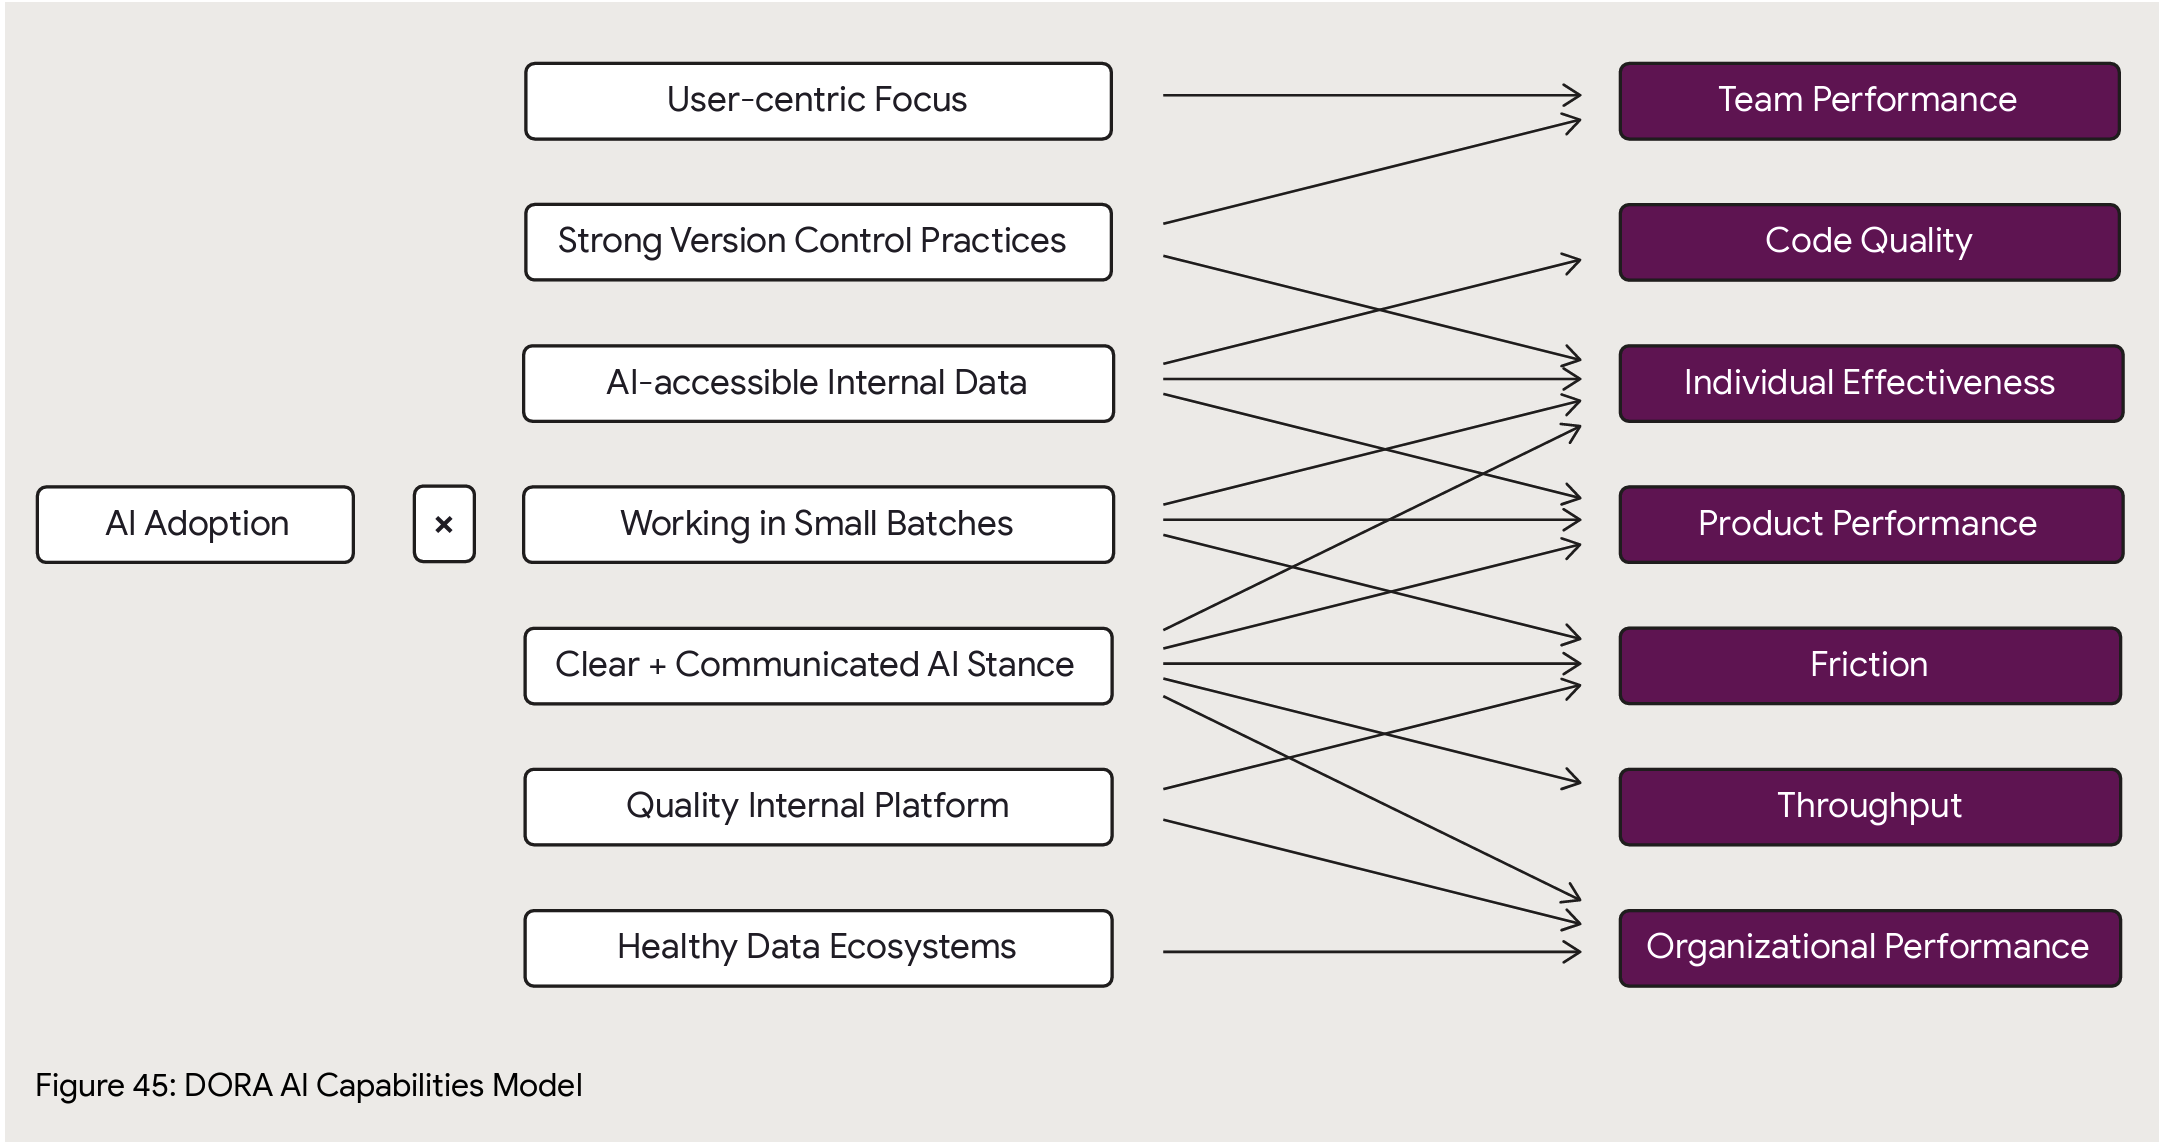
AI Capabilities Model

The reason I love DORA is they go deep and try to establish correlation of AI adoption best practices to outcomes. At page 49 is their big new framework for analysis of AI impact on an org. Here’s what they have so far on how specific practices correlate to specific outcomes, with caveats that it’ll take another year of data to know for sure (though AI innovation cycles are month by month, I hope they’ll find a way to get more data more quickly than a yearly cadence).

Platform Engineering

The report then takes another turn back to earlier DORA topics and talks about platform engineering, the benefits, and how to not suck at it.

For those who are unclear on that, you get wins from a platform that is user centric. So many organizations don’t – or deliberately mis- – understand that. You could call all the old centralized IT solutions from previous decades a “platform” – Tivoli, HP WhateverCenter, and so on – but they were universally hateful and got in the way of progress in the name of optimizing the work of some commodity team behind a ticket barrier. (I’ll be honest, there’s a lot of that at my current employer.)

I’m going to go a step farther than the report – if you don’t have a product manager guidlign your platform based on its end users’ needs, your platform is not really a platform, it’s a terrible efficiency play that is penny wise but pound foolish. Fight me.

Anyway, they then say “platforms, you know, it’s the place you can plug in AI.” Which is fine but a little basic.

Value Stream Management

Is important. The premise here is that given the basic premise of value flow (if you don’t know about lean and value streams and stuff, I’ve got a LinkedIn Learning course for you: DevOps Foundations: Lean and Agile), systems thinking dictates that if you accelerate pieces in your workflow you can actually harm your overall throughput, so major changes mean you need to revisit the overall value stream to make sure it’s still the right flow, and measure so you understand how speeding up pieces (like oh say making code) affects other pieces (like oh say release stability).

They find that AI adoption gets you a lot more net benefit in organizations that understand and engineer their value stream.

The AI Mirror

This section tries to address the mix of benefits and detriments we’ve already talked about with AI. It basically just says hey, rethink how you do stuff and see if you can use AI in a more targeted way to improve the bad pieces, so for software delivery try using it more for code reviews and in your delivery pipelines. It’s fine but pretty handwavey.

That’s understandable, I don’t think anyone’s meaningfully figured out how to bring AI to bear on the post-code writing part of the software delivery pipeline. There’s a bunch of hopefuls in this space but everything I’ve kicked the tires on seems still pretty sketch.

Metrics Frameworks

You need metrics to figure out if what you’re doing is helping or not. They mention frameworks like SPACE, DevEx, HEART, and DORA’s software delivery metrics, and note that you should be looking at developer experience, product excellence, and organizational effectiveness. “Does AI change this?” Maybe, probably not as much as you think.

And that’s the end at page 96, there’s 50 pages of credits and references and data and methodology if you want to get into it.

Those last 4 chapters feel more like an appendix, they don’t really flow with the rest of the report. The AI methodology talks about things to do specifically boost your AI capabilities (Clear and communicated AI stance… Working in small batches) which somewhat overlap (Quality internal platforms, User-centric focus) with these later chapters but to a degree don’t. If value stream management is shown to improve your AI outcomes then – why’s it not in the capability model?

I assume the answer is, to a degree, “Hey man this is a work in progress” which is fair enough.

Conclusion

I find two major benefits from reports like this, and judge their success based on how well they achieve them.

  1. Showing clear benefits of something, so you can use it to influence others to adopt it. This report does very well there. One of my complaints about the DORA reports is that in recent years they’d become more about the “next big thing” than about demonstrating the clear benefits of core DevOps practices, so I’d often go back and refer to older reports instead of the newer ones. But here – are people getting benefit from AI? Yes, and here’s what, and here’s what not. Very cleaar and well supported.
  2. Telling you how to best go about doing something, so you can adopt it more effectively. The report also does well here, with the caveat of “so much of this is still emerging and moving at hyperspeed that it’s hard to know.” They’ve identified practices within AI adoption and in the larger organization that are correlated to better outcomes, and that’s great.

And I do like the mix of old and new in this report. You have to wave the new shiny at people to get them to pay attention, but in the end there are core truths about running a company and a technology organization within a company – value streams, metrics, developer experience, release cadence and quality – that AI or any new silver bullet may change the implementation of, but does not change fundamentally, and it’s a good reminder that adopting sound business basics is the best way to take advantage of any new opportunity, in this case AI.

TL;DR – Good report, use it to learn how people are benefitting from AI and to understand specific things you can do to make your organization benefit the most from it!

Leave a comment

Filed under AI, DevOps

Classy up your curl with curl-trace


Let’s say you are debugging some simple web requests and trying to discern where things are slowing down.  Curl is perfect for that.  Well, sort of perfect. I don’t know about you but I forget all the switches for curl to make it work like I want.  Especially in a situation where you need to do something quickly.

Let me introduce you to curl-trace.

It’s not a new thing to install, its just an opinionated way to run curl.  To give you a feel for what it does, lets start with the output from curl-trace.

Screenshot 2016-03-11 10.15.35

As you can see, this breaks up the request details like response code, redirects and IP in the Request Details section and then breaks down the timing of the request in the Timing Analysis section.  This uses curl’s --write-out option and was inspired by this post, this post, and my co-worker Marcus Barczak.

The goal of curl-trace is to quickly expose details for troubleshooting web performance.

How to setup curl-trace

Step 1

Download .curl-format from github (or copy from below)

\n
 Request Details:\n
 url: %{url_effective}\n
 num_redirects: %{num_redirects}\n
 content_type: %{content_type}\n
 response_code: %{response_code}\n
 remote_ip: %{remote_ip}\n
 \n
 Timing Analysis:\n
 time_namelookup: %{time_namelookup}\n
 time_connect: %{time_connect}\n
 time_appconnect: %{time_appconnect}\n
 time_pretransfer: %{time_pretransfer}\n
 time_redirect: %{time_redirect}\n
 time_starttransfer: %{time_starttransfer}\n
 ----------\n
 time_total: %{time_total}\n
 \n

And put that in your home directory as .curl-format or wherever you find convenient.

Step 2

Add an alias to your .bash_profile (and source .bash_profile) for curl-trace like this:


alias curl-trace='curl -w "@/path/to/.curl-format" -o /dev/null -s'

Be sure to change the /path/to/.curl-format to the location you saved .curl-format. Once you do that and source your .bash_profile you are ready to go.

Usage

Now you can run this:

$ curl-trace https://google.com

Or follow redirects with -L

$ curl-trace -L https://google.com

Thats it…

Now you are ready to use curl-trace. If you have anything to add to it, just send me an issue on github or a PR or ping me on twitter: https://twitter.com/wickett.

Enjoy!

UPDATE: 3/17/2016

There was a lot of good feedback on curl-trace so it has now been moved to its own repo: https://github.com/wickett/curl-trace


2 Comments

Filed under DevOps

Velocity 2013 Day 3: benchmarking the new front end

By Emily Nakashima and Rachel Myers

bitly.com/ostrichandyak

Talking about their experiences at mod cloth…..

Better performance is more user engagement, page views etc…

Basically, we’re trying to improve performance because it improves user experience.

A quick timeline on standards and js mvc frameworks from 2008 till present.

NewRelic was instrumented to get an overview of performance and performance metrics; the execs asked for a dashboard!! Execs love dashboard 🙂

Step 1: add a cdn; it’s an easy win!
Step 2: The initial idea was to render the easy part of the site first- 90% render.
Step 3: changed this to a single page app

BackboneJS was used to redesign the app to a single page app from the way the app was structured before.

There aren’t great tools for Ajax enabled sites to figure out perf issues. Some of the ones that they used were:
– LogNormal: rebranded as Soasta mpulse
– newrelic
– yslow
– webpagetest
– google analytics (use for front end monitoring, check out user timings in ga)- good 1st step!
– circonus (which is the favorite tool of the presenters)

Asynchronous world yo! Track:
– featurename
– pagename
– unresponsiveness

Velocity buzzwords bingo! “Front end ops”

Leave a comment

Filed under Cloud, Conferences

Velocity 2013 Day 2 Liveblog: Performance Troubleshooting Methodology

Stop the Guessing: Performance Methodologies for Production Systems

Slides are on Slideshare!

Brendan Gregg, Joyent

Note to the reader – this session ruled.

He’s from dtrace but he’s talking about performance for the rest of us. Coming soon, Systems Performance: Enterprises and the Cloud book.

Performance analysis – where do I start and what do I do?  It’s like troubleshooting, it’s easy to fumble around without a playbook. “Tools” are not the answer any more than they’re the answer to “how do I fix my car?”

Guessing Methodologies and Not Guessing Methodologies (Former are bad)

Anti-Methods

Traffic light anti-method

Monitors green?  You’re fine. But of course thresholds are a coarse grained tool, and performance is complex.  Is X bad?  Well sometimes, except when X, but then when Y, but…” Flase positives and false negatives abound.

You can improve it by more subjective metrics (like weather icons) – onjective is errors, alerts, SLAs – facts.

see dtrace.org status dashboard blog post

So traffic light is intuitive and fast to set up but it’s misleading and causes thrash.

Average anti-method

Measure the average/mean, assume a normal-like unimodal distribution and then focus your investigation on explaining the average.

This misses multiple peaks, outliers.

Fix this by adding histograms, density plots, frequency trails, scatter plots, heat maps

Concentration game anti-method

Pick a metric, find another that looks like it, investigate.

Simple and can discover correlations, but it’s time consuming and mostly you get more symptoms and not the cause.

Workload characterization method

Who is causing the load, why, what, how. Target is the workload not the performance.

lets you eliminate unnecessary work. Only solves load issues though, and most things you examine won’t be a problem.

[Ed: When we did our Black Friday performance visualizer I told them “If I can’t see incoming traffic on the same screen as the latency then it’s bullshit.”]

USE method

For every resource, check utilization, saturation, errors.

util: time resource busy

sat: degree of queued extra work

Finds your bottlenecks quickly

Metrics that are hard to get become feature requests.

You can apply this methodology without knowledge of the system (he did the Apollo 11 command module as an example).

See the use method blog post for detailed commands

For cloud computing you also need the “virtual” resource limits – instance network caps. App stuff like mutex locks and thread pools.  Decompose the app environment into queueing systems.

[Ed: Everything is pools and queues…]

So go home and for your system and app environment, create a USE checklist and fill out metrics you have. You know what you have, know what you don’t have, and a checklist for troubleshooting.

So this is bad ass and efficient, but limited to resource bottlenecks.

Thread State Analysis Method

Six states – executing, runnable, anon paging, sleeping, lock, idle

Getting this isn’t super easy, but dtrace, schedstats, delay accounting, I/O accounting, /proc

Based on where the time is leads to direct actionables.

Compare to e.g. database query time – it’s not self contained. “Time spent in X” – is it really? Or is it contention?

So this identifies, quantifies, and directs but it’s hard to measure all the states atm.

There’s many more if perf is your day job!

Stop the guessing and go with ones that pose questions and seek metrics to answer them.  P.S. use dtrace!

dtrace.org/blogs/brendan

Leave a comment

Filed under Conferences, DevOps

Velocity 2013 Day 1 Liveblog – Hands-on Web Performance Optimization Workshop

OK we’re wrapping up the programming on Day 1 of Velocity 2013 with a Hands-on Web Performance Optimization Workshop.

Velocity started as equal parts Web front end performance stuff and operations; I was into both but my path lead me more to the operations side, but now I’m trying to catch up a bit – the whole CSS/JS/etc world has grown so big it’s hard to sideline in it.  But here I am!  And naturally performance guru Steve Souders is here.  He kindly asked about Peco, who isn’t here yet but will be tomorrow.

One of the speakers is wearing a Google Glass, how cute.  It’s the only other one I’ve seen besides @victortrac’s. Oh, the guy’s from Google, that explains it.

@sergeyche (TruTV), @andydavies (Asteno), and @rick_viscomi (Google/YouTube) are our speakers.

We get to submit URLs in realtime for evaluation at man.gl/wpoworkshop!

Tool Roundup

Up comes webpagetest.org, the great Web site to test some URLs. They have a special test farm set up for us, but the abhorrent conference wireless largely prevents us from using it. “It vill disappear like pumpkin vunce it is over” – sounds great in a Russian accent.

YSlow the ever-popular browser extension is at yslow.org.

Google Pagespeed Insights is a newer option.

showslow.com trends those webpagetest metrics over time for your site.

Real Page Tests

Hmm, since at Bazaarvoice we don’t really have pages per se, we’re just embedded in our clients’ sites, not sure what to submit!  Maybe I’ll put in ni.com for old times’ sake, or a BV client. Ah, Nordstrom’s already submitted, I’ll add Yankee Candle for devious reasons of my own.

redrobin.com – 3 A’s, 3 F’s. No excuse for not turning on gzip. Shows the performance golden rule – 10% of the time is back end and 90% is front end.

“Why is my time to first byte slow?”  That’s back end, not front end, you need another tool for that.

nsa.gov – comes back all zeroes.  General laughter.

Gus Mayer – image carousel, but the first image it displays is the very last it loads.  See the filmstrip view to see how it looks over time. Takes like 6 seconds.

Always have a favicon – don’t have it 404. And especially don’t send them 40k custom 404 error pages. [Ed. I’ll be honest, we discovered we were doing that at NI many years ago.] It saves infrastructure cost to not have all those errors in there.

Use 85% lossy compression on images.  You can’t tell even on this nice Mac and it saves so much bandwidth.

sitespeed.io will crawl your whole site

speedcurve is a paid service using webpagetest.

Remember webpagetest is open source, you can load it up yourself (“How can we trust your dirty public servers!?!” says a spectator).

Mobile

webpagetest has some mobile agents

httpwatch for iOS

1 Comment

Filed under Conferences, DevOps

Service Delivery Best Practices?

So… DevOps.  DevOps vs NoOps has been making the rounds lately. At Bazaarvoice we are spawning a bunch of decentralized teams not using that nasty centralized ops team, but wanting to do it all themselves.  This led me to contemplate how to express the things that Operations does in a way that turns them into developer requirements?

Because to be honest a lot of our communication in the Ops world is incestuous.  If one were to point a developer (or worse, a product manager) at the venerable infrastructures.org site, they’d immediately poop themselves and flee.  It’s a laundry list of crap for neckbeards, but spends no time on “why do you want this?” “What value will this bring to your customer?”

So for the “NoOps” crowd who want to do ops themselves – what’s an effective way to state these needs?  I took previous work – ideas from the pretty comprehensive but waterfally “Systems Development Framework” Peco and I did for NI, Chris from Bazaarvoice’s existing DevOps work – and here’s a cut.  I’d love feedback. The goal is to have a small discrete set of areas (5-7), with a small discrete set (5-7) of “most important” items – most importantly, stated in a way so that people understand that these aren’t “annoying things some ops guy wants me to do instead of writing 3l33t code” but instead stated as they should be, customer facing requirements like any other.  They could then be each broken into subsidiary more specific user stories (probably a whole lot of them, to be honest) but these could stand in as “epics” or “pillars” for making your Web thing work right.

Service Delivery Best Practices

Availability

  • I will make my service highly available, so that customers can use it constantly without issues
  • I will know about any problems with my service’s delivery to customers
  • I can restore my service quickly from any disaster or loss
  • I can make my data resistant to corruption from runtime issues
  • I will test my service under routine disruption to make it rugged and understand its failure modes

Performance

  • I know how all parts of the product perform and can measure performance against a customer SLA
  • I can run my application and its data globally, to serve our global customer base
  • I will test my application’s performance and I know my app’s limitations before it reaches them

Support

  • I will make my application supportable by the entire organization now and in the future
  • I know what every user hitting my service did
  • I know who has access to my code and data and release mechanism and what they did
  • I can account for all my servers, apps, users, and data
  • I can determine the root cause of issues with my service quickly
  • I can predict the costs and requirements of my service ahead of time enough that it is never a limiter
  • I will understand the communication needs of customers and the organization and will make them aware of all upgrades and downtime
  • I can handle incidents large and small with my services effectively

Security

  • I will make every service secure
  • I understand Web application vulnerabilities and will design and code my services to not be subject to them
  • I will test my services to be able to prove to customers that they are secure
  • I will make my data appropriately private and secure against theft and tampering
  • I will understand the requirements of security auditors and expectations of customers regarding the security of our services

Deployment

  • I can get code to production quickly and safely
  • I can deploy code in the middle of the day with no downtime or customer impact
  • I can pilot functionality to limited sets of users
  • I will make it easy for other teams to develop apps integrated with mine

Also to capture that everyone starting out can’t and shouldn’t do all of this… We struggled over whether these were “Goals” or “Best Practices” or what… On the one hand you should only put in e.g. “as much security as you need” but on the other hand there’s value in understanding the optimal condition.

2 Comments

Filed under DevOps

Application Performance Management in the Cloud

Cloud computing has been the buzz and hype lately and everybody is trying to understand what it is and how to use it. In this post, I wanted to explore some of the properties of “the cloud” as they pertain to Application Performance Management. If you are new to cloud offerings, here are a few good materials to get started, but I will assume the reader of this post is somewhat familiar with cloud technology.

As Spiderman would put it, “With great power comes great responsibility” … Cloud abstracts some of the infrastructure parts of your system and gives you the ability to scale up resource on demand. This doesn’t mean that your applications will magically work better or understand when they need to scale, you still need to worry about measuring and managing the performance of your applications and providing quality service to your customers. In fact, I would argue APM is several times more important to nail down in a cloud environment for several reasons:

  1. The infrastructure your apps live in is more dynamic and volatile. For example, cloud servers are VMs and resources given to them by the hypervisor are not constant, which will impact your application. Also, VMs may crash/lock up and not leave much trace of what was the cause of issues with your application.
  2. Your applications can grow bigger and more complex as they have more resources available in the cloud. This is great but it will expose bottlenecks that you didn’t anticipate. If you can’t narrow down the root cause, you can’t fix it. For this, you need scalable APM instrumentation and precise analytics.
  3. On-demand scaling is a feature that is touted by all cloud providers but it all hinges on one really hard problem that they won’t solve for you: Understanding your application performance and workload behave so that you can properly instruct the cloud scaling APIs what to do. If my performance drops do I need more machines? How many? APM instrumentation and analytics will play a key part of how you can solve the on-demand scaling problem.

So where is APM for the cloud, you ask? It is in its very humble beginnings as APM solution providers have to solve the same gnarly problems application developers and operations teams are struggling with:

  1. Cloud is dynamic and there are no fixed resources. IP addresses, hostnames, and MAC addresses change, among other things. Properly addressing, naming and connecting the machines is a challenge – both for deep instrumentation agent technology and for the apps themselves.
  2. Most vendors’ licensing agreements are based on fixed count of resources billing rather than a utility model, and are therefore difficult to use in a cloud environment. Charging a markup on the utility bill seems to be a common approach among the cloud-literate but introduces a kink in the regular budgeting process and no one wants to write a variable but sizable blank check.
  3. Well the cloud scales… a lot. The instrumentation / monitoring technology has to be low enough overhead and be able to support hundreds of machines.

On the synthetic monitoring end there are plenty of options. We selected AlertSite, a distributed synthetic monitoring SaaS provider similar to Keynote and Gomez, for simplicity but in only provides high level performance and availability numbers for SLA management and “keep the lights are on” alerting. We also rely on CloudKick, another SaaS provider, for the system monitoring part. Here is a more detailed use case on the Cloudkick implementation.

For deeper instrumentation we have worked with OPNET to deploy their AppInternals Xpert (former Opnet Panorama) solution in the Amazon EC2 cloud environment. We have already successfully deployed AppInternals Xpert on our own server infrastructure to provide deep instrumentation and analysis of our applications. The cloud version looks very promising for tackling the technical challenges introduced by the cloud, and once fully deployed, we will have a lot of capability to harness the cloud scale and performance. More on this as it unfolds…

In summary, as vendors sell you the cloud but be prepared to tackle the traditional infrastructure concerns and stick to your guns. No, the cloud is not fixing your performance problems and is not going to magically scale for you. You will need some form of APM to help you there. Be on the lookout for providers and do challenge your existing partners to think of how they can help you. The APM space in the cloud is where traditional infrastructure was in 2005 but things are getting better.

To the cloud!!! (And do keep your performance engineers on staff, they will still be saving your bacon.)

Peco

Leave a comment

Filed under Cloud

Velocity 2010 – Performance Indicators In The Cloud

Common Sense Performance Indicators in the Cloud by Nick Gerner (SEOmoz)

SEOmoz has been  EC2/S3 based since 2008.  They scaled from 50 to 500 nodes.  Nick is a developer who wanted him some operational statistics!

Their architecture has many tiers – S3, memcache, appl, lighttpd, ELB.  They needed to visualize it.

This will not be about waterfalls and DNS and stuff.  He’s going to talk specifically about system (Linux system) and app metrics.

/proc is the place to get all the stats.  Go “man proc” and understand it.

What 5 things does he watch?

  • Load average – like from top.  It combines a lot of things and is a good place to start but explains nothing.
  • CPU – useful when broken out by process, user vs system time.  It tells you who’s doing work, if the CPU is maxed, and if it’s blocked on IO.
  • Memory – useful when broken out by process.  Free, cached, and used.  Cached + free = available, and if you have spare memory, let the app or memcache or db cache use it.
  • Disk – read and write bytes/sec, utilization.  Basically is the disk busy, and who is using it and when?  Oh, and look at it per process too!
  • Network – read and write bytes/sec, and also the number of established connections.  1024 is a magic limit often.  Bandwidth costs money – keep it flat!  And watch SOA connections.

Perf Monitoring For Free

  1. data collection – collectd
  2. data storage- rrdtool
  3. dashboard management – drraw

They put those together into a dashboard.  They didn’t want to pay anyone or spend time managing it.  The dynamic nature of the cloud means stuff like nagios have problems.

They’d install collectd agents all over the cluster.  New nodes get a generic config, and node names follow a convention according to role.

Then there’s a dedicated perf server with the collectd server, a Web server, and drraw.cgi.  In a security group everyone can connect in to.

Back up your performance data- it’s critical to have history.

Cloudwatch gives you stuff – but not the insight you have when breaking out by process.  And Keynote/Gomez stuff is fine but doesn’t give you the (server side) nitty gritty.

More about the dashboard. Key requirements:

  • Summarize nodes and systems
  • Visualize data over time
  • Stack measurements per process and per node
  • Handle new nodes dynamically w/o config chage

He showed their batch mode dashboard.  Just a row per node, a metric graph per column.  CPU broken out by process with load average superimposed on top.  You see things like “high load average but there’s CPU to spare.”  Then you realize that disk is your bottleneck in real workloads.  Switch instance types.

Memory broken out by process too.  Yay for kernel caching.

Disk chart in bytes and ops.  The steady state, spikes, and sustained spikes are all important.

Network – overlay the 95th percentile cause that’s how you get billed.

Web Server dashboard from an API server is a little different.

Add Web requests by app/request type.  app1, app2, 302, 500, 503…  You want to see requests per second by type.

mod_status gives connections and children idleness.

System wide dashboard.  Each graph is a request type, then broken out by node.  And aggregate totals.

And you want median latency per request.  And any app specific stuff you want to know about.

So get the basic stats, over time, per node, per process.

Understand your baseline so you know what’s ‘really’ a spike.

Ad hoc tools -try ’em!

  • dstat -cdnml for system characteristics
  • iotop for per process disk IO
  • iostat -x 3 for detailed disk stats
  • netstat -tnp for per process TCP connection stats

His slides and other informative blog posts are at nickgerner.com.

A good bootstrap method… You may want to use more/better tools but it’s a good point that you can certainly do this amount for free with very basic tooling, so something you pay for best be better! I think the “per process” intuition is the best takeaway; a lot of otherwise fancy crap doesn’t do that.

But in the end I want more – baselines, alerting, etc.

Leave a comment

Filed under Cloud, Conferences, DevOps

Velocity 2010 – Day 3 Demos and More

Check out the Velocity 2010 flickr set!  And YouTube channel!

Time for lightning demos.

HTTPWatch

A HTTP browser proxy that does the usual waterfalls from your Web pages.  Version 7 is out!  You can change fonts.  They work in IE and Firefox both, unlike the other stuff.

Rather than focus on ranking like YSlow/PageSpeed, they focus on showing specific requests that need attention.  Same kind of data but from a different perspective.  And other warnings, not all strictly perf related.  Security, etc.  Exports and consumes HAR files (the new standard for http waterfall interchange).

webpagetest.org

Based on AOL Pagetest, an IE module, but hosted.  Can be installed as a private site too.  It provides obejct timing and waterfalls.  Allows testing from multiple locations and network speeds, saved them historically. Like a free single-snapshot version of Keynote/Gomez kinds of things.

Shows stuff like browser CPU and bandwidth utilization and does visual comparisons, showing percieved performance in filmstrip view and video.

And does HAR  import/export!  Ah, collaboration.

The CPU/net metrics show some “why” behind gaps in the waterfalls.

The filmstrip side by side view shows different user experiences very well.  And you can do video, as that is sexy.

They have a new UI built by a real designer (thanks Neustar!).

Speed Tracer

But what about Chrome, you ask?  We have an extension for that now.  Similar to PageSpeed.  The waterfall timeline is beautiful, using real “Google Finance” style visualization.  The other guys aren’t like RRDTool ugly but this is super purty.

It will deobfuscate JavaScript and integates it with Eclipse!

They’re less worried about network waterfall and more about client side render.  A lot of the functionality is around that.

You can send someone a Speed Trace dump file for debug.

Fiddler2

Are you tired of being browser dependent?  Fiddler has your back.

New features…  Hey, platform preview 3 for IE9 is out.  It has some tools for capture and export.; it captures traffic in a XML serialised HAR.  Fiddler imports JSON HAR from norms and the IE9 HAR!  And there’s HAR 1.1!  Eeek.  And wcat.  It imports lots of different stuff in other words.

I want one of these to take in Wireshark captures and rip out all the crap and give me the HTTP view!

FiddlerCap Web recorder (fiddlercap.com) lets people record transactions and send it to you.

Side by side viewingwith 2 fiddlers  if you launch with -viewer.

There’s a comparison extension called differ.  Nice!

You can replay captures, including binarieis now, with the AutoResponder tab.  And it’ll play latency soon.

We still await the perfect HTTP full capture and replay toolchain… We have our own HTTP log replayer we use for load tests and regression testing, if we could do this but in volume it would rock…

Caching analysis.  FiddlerCore library you can put in your app.

Now, Bobby Johnson of Facebook speaks on Moving Fast.

Building something isn’t hard, but you don’t know how people will use it, so you have to adapt quickly and make faster changes.

How do you get to a fast release cycle?  Their biggest requirement is “the site can’t go down.”  So they go to frequent small changes.

Most of the challenge when something goes wrong isn’t fixing it, it’s finding out what went wrong so you can fix it.  Smaller changes make that easier.

They take a new thing, push some fake traffic to it, then push a % of user traffic, and then dial back if there’s problems.

If you aren’t watching something, it’ll slip.  They had their performance at 5s; did a big improvement and got it to 2.5.  But then it slips back up.  How do you keep it fast (besides “don’t change anything?”)  They changed their organization to make quick changes but still maintain performance.

What makes a site get slow?  It’s not a deep black art.  A lot of it is jus tnot paying attention to your performance – you can’t foresee new code to not have bugs or not have performance problems.

  • New code is slow
  • More code is slow

“Age the code” by allocating time to shaking out performance problems – not just before, but after deploy.

  • Big pipe – break the page into small pieces and pipelines it.
  • Primer – a JavaScritp library that bootstraps by dl’ing the minimum first.

Both separate code into a fast path and a slow path and defaults to the slow path.

I have a new “poke” feature I want to try… I add it in as a lazy loaded thing and see if anyone cares, before I spend huge optimization time.

It gets popular!  OK, time to figure out performance on the fast path.

So they engineer performance per feature, which allows prioritization.

You can have a big metric collection and reporting tool.  But that’s different from alerting tools.  Granularity of alerting – no one wants to get paged on “this one server is slow.”  But no one cares about “the whole page is 1% slower” either.  But YOUR FEATURE is 50% slower than it was – that someone cares about.  Your alert granularity needs to be at the level of “what a single person works on.”

No one is going to fix things if they don’t care about it.  And also not unless they have control over it (like deploying code someone else wrote and being responsible for it breaking the site!). And they need to be responsible for it.

They have tried various structures.  A centralized team focused on performance but doesn’t have control over it (except “say no” kinds of control).

Saying “every dev is responsible for their perf” distributes the responsibility well, but doesn’t make people care.

So they have adopted a middle road.  There’s a central team that builds tools and works with product teams.  On each product team there is a performance point person.  This has been successful.

Lessons learned:

  • New code is slow
  • Give developers room to try things
  • Nobody’s job is to say no

Joshua from Strangeloop on The Mobile Web

Here we all know that performance links directly to money.

But others (random corporate execs) doubt it.  And what about the time you have to spend?  And what about mobile?

We need to collect more data

Case study – with 65% performance increase, 6% order size increase and 9% conversion increase.

For mobile, 40% perf led to 3% order size and 5% conversion.

They have a conversion rate fall-off by landing page speed graph, so you can say what a 2 second improvement is worth.  And the have preliminary data on mobile too.

I think  he’s choosing a very confusing way to say you need mttrics to establish the ROI of performance changes.  And MOBILE IS PAYING MONEY RIGHT NOW!

Cheryl Ainoa from Yahoo! on Innovation at Scale

The challenges of scale – technical complexity and outgrowing many tools and techniques, there are no off hours, and you’re a target for abuse.

Case Study: Fighting Spam with Hadoop

Google Groups was sending 20M emails/day to Taiwan and there’s only 18M Internet users in Taiwan.  What can help?  Nothing existing could do that volume (spamcop etc.)  And running their rules takes a couple days.  So they used hadoop to drive indications of “spammy” groups in parallel. Cut mail delivered by 5x.

Edge pods – small compute footprints to optimize cost and performance.  You can’t replicate your whole setup globally.  But adding on to a CDN is adding some compute capability to the edge in “pods.”  They have a proxy called YCPI to do this with.

And we’re out of time!

Leave a comment

Filed under Conferences, DevOps

Velocity 2010: Day 2 Keynotes Continued

Back from break and it’s time for more!  The dealer room was fricking MOBBED.  And this is with a semi-competing cloud computing convention, Structure,  going on down the road.

Lightning Demos

Time for a load of demos!

dynaTrace

Up first is dynaTrace, a new hotshot in the APM (application performance management) space.  We did a lot of research in this space (well, the sub-niche in this space for deep dive agent-driven analytics), eventually going with Opnet Panorama over CA/Wily Introscope, Compuware, HP, etc.  dynaTrace broke onto the scene since and it seems pretty pimp.  It does traditional metric-based continuous APM and also has a “PurePath” technology where they inject stuff so you can trace a transaction through the tiers it travels along, which is nice.

He analyzed the FIFA page for performance.  dynaTrace is more of a big agenty thing but they have an AJAX edition free analyzer that’s more light/client based.  A lot of the agent-based perf vendors just care about that part, and it’s great that they are also looking at front end performance because it all ties together into the end user experience.  Anyway, he shows off the AJAX edition which does a lot of nice performance analysis on your site.  Their version 2.0 of Ajax Edition is out tomorrow!

And, they’re looking at how to run in the cloud, which is important to us.

Firebug

A Firefox plugin for page inspection, but if you didn’t know about Firebug already you’re fired.  Version 1.6 is out!  And there’s like 40 addons for it now, not just YSlow etc, but you don’t know about them – so they’re putting together “swarms” so you can get more of ’em.

In the new version you can see paint events.  And export your findings in HAR format for portability across tools of this sort.  Like httpwatch, pagespeed, showslow.  Nice!

They’ve added breakpoints on network and HTML events.  “FireCookie” lets you mess with cookies (and breakpoints on this too).

YSlow

A Firebug plugin, was first on the scene in terms of awesome Web page performance analysis.  showslow.com and gtmetrix.com complement it.   You can make custom rules now.  WTF (Web Testing Framework) is an new YSlow plugin that tests for more shady dev practices.

PageSpeed

PageSpeed is like YSlow, but from Google!  They’ve been working on turning the core engine into an SDK so it can be used in other contexts.  Helps to identify optimizations to get time to first pane, making JS/CSS recommendations.

The Big Man

Now it’s time for Tim O’Reilly to lay down the law on us.  He wrote a blog post on operations being the new secret sauce that kinda kicked off the whole Velocity conference train originally.

Tim’s very first book was the Massacomp System Administrator’s Guide, back in 1983.  System administration was the core that drove O’Reilly’s book growth for a long time.

Applications’ competitive advantage is being driven by large amounts of data.  Data is the “intel inside” of the new generation of computing.  The “internet operating system” being built is a data operating system.  And mobile is the window into it.

He mentioned OpenCV (computer vision) and Collective Intelligence, which ended up suing the same kinds of algorithms.  So that got his thinking about sensors and things like Arduino.  And the way technology evolves is hackers/hobbyists to innovators/entrepreneurs.  RedLaser, Google Goggles, etc. are all moves towards sensors and data becoming pervasive.  Stuff like the NHIN (nationwide health information network).  CabSense.  AMEE, “the world’s energy meter” (or at least the UK’s) determined you can tell the make and model of someone’s appliances based on the power spike!  Passur has been gathering radar data from sensors, feeding through algorithms, and now doing great prediction.

Apps aren’t just consumed by humans, but by other machines.  In the new world every device generates useful data, in which every action creates “information shadows” on the net.

He talks about this in Web Squared.  Robotics, augmented reality, personal electronics, sensor webs.

More and more data acquisition is being fed back into real time response – Walmart has a new item on order 20 seconds after you check out with it.  Immediately as someone shows up at the polls, their name is taken off the call-reminder list with Obama’s Project Houdini.

Ushahidi, a crowdsourced crisis mapper.  In Haiti relief, it leveraged tweets and skype and Mechanical Turk – all these new protocls were used to find victims.

And he namedrops Opscode, the Chef guys – the system is part of this application.  And the new Web Operations essay book.  Essentially, operations are who figures out how to actually do this Brave New World of data apps.

And a side note – the closing of the Web is evil.  In The State of the Internet Operating System, Tim urges you to collaborate and cooperate and stay open.

Back to ops – operations is making some pretty big – potentially world-affecting- decisions without a lot to guide us.  Zen and the Art of Motorcycle Maintenance will guide you.  And do the right thing.

Current hot thing he’s into – Gov2.0!  Teaching government to think like a platform provider.  He wants our help to engage with the government and make sure they’re being wise and not making technopopic decisions.

Code for America is trying to get devs for city governments, which of course are the ass end of the government sandwich – closest to us and affecting our lives the most, but with the least funds and skills.

Third Party Pain

And one more, a technical one, on the effects of third party trash on your Web site – “Don’t Let Third Parties Slow You Down“, by Google’s Arvind Jain and Michael Kleber.  This is a good one – if you run YSlow on our Web site, www.ni.com, you’ll see a nice fast page with some crappy page tags and inserted JS junk making it half as fast as it should be.  Eloqua, Unica, and one of our own demented design layers an extra like 6s on top of a nice sub-2s page load.

Adsense adds 12% to your page load.  Google Analytics adds 5% (and you should use the new asynchronous snippet!).  Doubleclick adds 11.5%.  Digg, FacebookConnect, etc. all add a lot.

So you want to minimize blocking on the external publisher’s content – you can’t get rid of them and can’t make them be fast (we’ve tried with Eloqua and Unica, Lord knows).

They have a script called ASWIFT that makes show_ads.js a tiny loader script.  They make a little iframe and write into it.  Normally if you document.write, you block the hell out of everything.  Their old show_ads.js had a median of 47 ms and a 90th percentile of 288 ms latency – the new ASWIFT one has a mdeian of 11 ms and a 90th %ile of 32 ms!!!

And as usual there’s a lot of browser specific details.  See the presentation for details.  They’re working out bugs, and hope to use this on AdSense soon!

Leave a comment

Filed under Conferences, DevOps